
The strongest approach pairs a short, validated productivity-impact tool, such as the SPS-6 or WPAI, with a simple behavior question about days worked while sick, then converts the results into lost hours using wage multipliers. Choose brief instruments for ongoing monitoring and longer ones like WLQ when evaluating a specific intervention. Treat every dollar figure as an estimate: self-report tools carry real psychometric limits, and local validation matters more than most vendors admit.
TL;DR:
- Short, validated tools like SPS-6 or WPAI paired with a simple behavior question provide the most effective way to measure presenteeism related productivity loss.
- Method selection should match the purpose; behavioral, self-rated, and objective proxies each suit ongoing monitoring, intervention evaluation, or cost modeling.
- The SPS-6 is widely validated and quick, but recent studies reveal it measures two distinct factors, which affects scoring and intervention focus.
- Combining self-report instruments with objective data like absence logs or output metrics helps identify discrepancies and improve measurement accuracy.
- Industry-specific adaptations, proper recall periods, and careful cultural validation are essential to obtaining honest, comparable presenteeism data.
Table of Contents
- What Is Presenteeism Measurement and Why Method Choice Matters
- Which Presenteeism Instruments Should You Use?
- How Reliable Are Presenteeism Instruments? Reading the Psychometric Evidence
- How to Calculate the Cost of Presenteeism
- How Should You Design a Presenteeism Survey?
- How Do You Turn Presenteeism Data Into Action?
- How Inspire-wellness Applies This Playbook in Practice
- How Do Company Culture and Job Role Shape Presenteeism Measurement?
- Self-Reported vs. Objective Presenteeism Measures: Which Is More Accurate?
- What New Technologies Are Emerging in Presenteeism Measurement?
- How Do Industry-Specific Factors Change Presenteeism Measurement?
- Why the Real Value of Presenteeism Measurement Is Rarely Where People Look
- Ready to Measure and Reduce Presenteeism in Your Organization?
- Sources
What Is Presenteeism Measurement and Why Method Choice Matters
Presenteeism measurement is the process of quantifying productivity loss that happens when employees show up to work while sick, distracted, or otherwise impaired, rather than counting the days they stay home. Absenteeism tracking answers a different question. It tells you who did not come in. Presenteeism measurement tells you what happened to output when someone did.
That distinction changes everything about how you design your evaluation. You have three broad families of methods to choose from, and picking the wrong one for your goal wastes both budget and credibility with leadership.
Behavioral measures ask a factual question: how many days did you work in the past month or year while feeling too unwell to be fully productive? These are easy to answer and easy to audit, but they say nothing about how much output was actually lost on those days.
Productivity-impact measures ask employees to rate the effect directly, usually on a 0 to 10 scale or as a percentage of normal output. These get closer to the real cost but depend heavily on how people interpret the scale, and different scaling approaches produce meaningfully different loss estimates in comparative studies of Canadian working populations.
Objective or proxy methods skip self-report entirely, relying on absence records, output KPIs, error rates, or digital activity logs. These avoid recall bias but rarely capture presenteeism on its own. A drop in output could reflect illness, a slow quarter, or a broken process, and disentangling the cause requires context self-report data provides.
Matching method to objective is the first decision that determines whether your data holds up:
- Ongoing surveillance or population monitoring: favor short, low-burden instruments you can repeat quarterly without survey fatigue.
- Intervention evaluation: favor instruments sensitive enough to detect change after a program, even if they take longer to complete.
- Economic costing for leadership: favor instruments with a direct path to hours or dollars, since vague severity scores are hard to defend in a budget meeting.
Most organizations end up running two instruments in parallel: a fast productivity-impact tool for trend tracking, and periodic objective data pulls to sanity-check the self-report trend against real output. That combination catches the cases where self-report drifts away from reality, which happens more often than most HR teams expect.
Which Presenteeism Instruments Should You Use?
Five instruments dominate the published literature, and each fits a different job. No single tool works as a universal default. As one of the foundational papers on this topic notes, no universal gold standard exists for presenteeism measurement, and the SPQ and SPS-6 remain the two most frequently cited despite that gap.
-
Stanford Presenteeism Scale (SPS-6): Six items, typically a 4-week recall period, measuring how much health problems interfered with completing work and staying focused. It is quick to administer and widely validated across industries, making it the default choice for routine health-related productivity monitoring. Recent psychometric work shows the SPS-6 actually splits into two components, “completing work” and “avoiding distractions,” so scoring it as one aggregate number can mask which problem is really driving the score.
-
Single-Item Presenteeism Question (SPQ): One question, usually asking respondents to rate their overall productivity on a scale while at work despite health issues. It has almost zero respondent burden, which makes it ideal for pulse surveys or embedding inside a larger engagement survey, but a single item cannot capture nuance and its criterion validity is limited compared to multi-item scales.
-
Work Productivity and Activity Impairment questionnaire (WPAI): Six to seven items covering absenteeism, presenteeism, and overall work and activity impairment, with a 7-day recall window. It is the most commonly used instrument in health economics research because it produces a percentage impairment score that plugs directly into cost calculations.
-
Work Limitations Questionnaire (WLQ): Roughly 25 items across four domains, including time management, physical demands, mental and interpersonal demands, and output demands, with a 2-week recall period. Its length makes it better suited to formal intervention evaluation than routine monitoring, since it can detect subtler shifts in specific job functions.
-
Voluntary Productivity Loss (VOLP) or hours method: Rather than a fixed scale, this approach asks respondents to estimate lost hours directly, which then feeds straight into wage-based cost models without a conversion step.
For quick health-related tracking across a large workforce, the SPS-6 is the practical default. For detailed economic costing, WPAI or the hours method map more directly to dollars. For evaluating whether a specific wellbeing program moved the needle, the longer WLQ picks up changes shorter tools miss.
How Reliable Are Presenteeism Instruments? Reading the Psychometric Evidence
Before adopting any instrument, you need to know whether it actually measures what it claims to measure, consistently, across the population you plan to survey. Three statistics do most of the work here.
Cronbach’s alpha tells you internal consistency: whether items meant to measure the same construct actually correlate with each other. A published alpha above 0.70 is generally considered acceptable, and most validated presenteeism scales report figures in that range, though a high alpha alone does not prove the scale measures the right thing.
Confirmatory factor analysis (CFA) tests whether the data actually fits the structure the scale designers intended, such as a single factor or multiple subscales. This is where the SPS-6 story gets interesting: recent psychometric re-examination found the instrument fits a two-factor model, “completing work” and “avoiding distractions,” better than the traditional single aggregated score. That has a real implication for practitioners: a low overall SPS-6 score could mean an employee struggles to finish tasks, struggles to concentrate, or both, and lumping those together into one number erases a distinction that points to two very different interventions.
AVE and CR (average variance extracted and composite reliability) go a step deeper, checking whether items within a factor share enough common variance to be trusted as a coherent measure rather than a loosely related grab bag of questions.
- Aim for a pilot sample of 100 to 300 respondents before adopting any instrument in a new organization or language, per validation guidance from the SPS-6 re-examination research.
- Run cognitive interviews with a small group first to catch wording that translates awkwardly or gets interpreted differently across roles.
- Re-check reliability statistics after translation. A scale validated in English does not automatically hold up once translated into another language.
- Treat any single validation study, including this article’s cited sources, as a starting point rather than proof the instrument will behave identically in your workforce.
Pro Tip: If you operate across multiple countries or language groups, budget for a small local pilot before rolling any instrument out company-wide. A 15-minute cognitive interview with ten employees often surfaces a translation problem that would have quietly distorted your entire dataset.
How to Calculate the Cost of Presenteeism
Turning survey answers into a dollar figure requires a formula, and the formula you choose materially changes the number leadership sees.
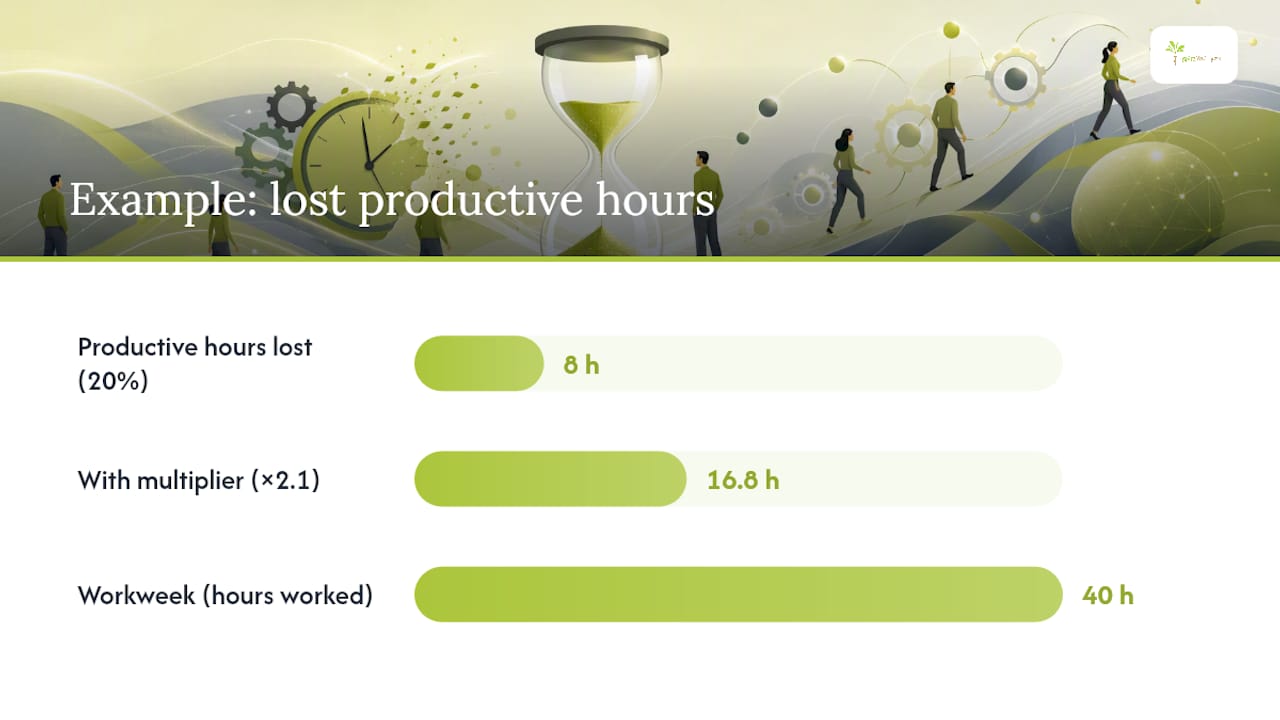
- Apply the hours method. Multiply the reported productivity loss percentage (or estimated lost hours) by hours worked, then multiply by hourly wage. Example: an employee earning $40 per hour who works 40 hours a week and reports 20% productivity impairment loses roughly 8 hours of productive output, worth about $320 that week.
- Convert scale scores carefully. When you use a 0 to 10 self-rated scale instead of direct hours, you need a defensible conversion to percent productivity loss. Be aware that scale-based methods tend to produce higher estimated loss than the hours method when applied to the same population, so switching methods mid-program will make your trend line look like it moved when it did not.
- Apply a wage multiplier. Raw wage cost understates the real organizational impact for roles where a delay cascades to colleagues, clients, or deadlines. Many economic evaluations apply a multiplier above 1.0 to reflect that ripple effect, particularly in team-dependent or client-facing roles.
- Run a sensitivity range, not a single number. Present a low, central, and high estimate rather than one figure.
The multiplier step is where most in-house calculations quietly go wrong. Research on compensation mechanisms and multiplier effects found compensation, colleagues or the employee absorbing part of the lost output, was reported in a notably high share of cases in one study, while multiplier effects appeared in a smaller subgroup but averaged a multiplier of roughly 2.1 where they occurred. That means a straightforward wage times hours calculation can be badly wrong in either direction depending on how coworkers actually absorb the slack. A separate line of compensation-mechanism research also flags that colleague compensation shows up in a meaningful minority of presenteeism cases, reinforcing that team-level effects belong in your model, not just individual wage math.
Systematic review evidence confirms presenteeism costs are frequently left out of formal economic evaluations altogether, and valuation methods differ enough across published studies that comparing your number to someone else’s benchmark is often misleading. Build your own baseline instead of chasing an external figure.
How Should You Design a Presenteeism Survey?
Recall period is the single most consequential design choice you will make, and it is also the one teams get wrong most often. A 7-day recall window, as used in the WPAI, produces sharper, more accurate self-report but limits you to snapshot data. A 3-month recall, closer to what some SPS-6 applications use, gives you a broader trend but invites memory decay and rounding bias.
Research comparing recall periods found that extrapolating short-window data out to represent a longer period tends to distort the picture. Never multiply a 7-day figure by 13 and call it a quarterly estimate. Measure at the interval you intend to report on.
- Default to a 7-day recall for frequent monitoring and a 1 to 3 month recall for annual reporting or program evaluation, and keep the two separate in your reporting.
- Sample representatively across departments, tenure, and shift patterns. A survey dominated by office staff will misrepresent frontline or shift-based roles.
- Repeat measurement on a fixed cadence, quarterly for pulse checks, annually for formal evaluation, rather than an ad hoc schedule that makes trend comparison impossible.
- Word questions in plain, specific language. “How often did health problems affect your ability to concentrate” outperforms vague phrasing like “how productive were you.”
- Offer the survey through the channel your workforce already uses daily, whether that is a mobile app, email, or an in-person kiosk for shift workers, to protect response rates.
Pro Tip: Pilot your wording with a group of 15 to 20 employees from different departments before a full rollout. Ambiguous phrasing tends to surface immediately once you watch people hesitate on a specific item.
How Do You Turn Presenteeism Data Into Action?
Raw scores mean little until you segment them. Break results down by team, role, and, where health data is available, condition type, since large-scale research on health-condition costs shows musculoskeletal problems and mental illness drive a disproportionate share of presenteeism-related economic burden.
- Rank potential interventions by impact times feasibility rather than by cost alone. A low-cost ergonomic fix for back pain often outranks an expensive wellness perk.
- Match the intervention to the driver: musculoskeletal support for physical strain, mental health resources for concentration and mood issues, workload redesign where the SPS-6 subscale points to “completing work” problems specifically.
- Set a measurable target tied to your chosen instrument’s score, then re-measure on the same cadence to track movement.
- When reporting to leadership, present the sensitivity range from your cost model, not a single number, and explain why the range exists.
How Inspire-wellness Applies This Playbook in Practice
Inspire-wellness builds presenteeism measurement directly into the baseline and follow-up stages of every corporate wellness engagement, rather than treating it as a one-off survey. We select the instrument to match the client’s objective, a brief SPS-6 style tool for ongoing monitoring, a fuller assessment when evaluating a specific program, and map findings against our Wellness Pyramid framework to prioritize interventions by impact and feasibility.
When organizations commission this work, we recommend confirming a few things upfront:
- Clear scope: which population, which recall period, and which objective (monitoring, evaluation, or costing) the engagement will serve.
- A realistic timeline that includes a pilot phase before full rollout.
- Defined deliverables: a baseline report, an intervention plan, and a follow-up measurement to demonstrate change.
How Do Company Culture and Job Role Shape Presenteeism Measurement?
A finance analyst and a warehouse supervisor experience presenteeism differently, and asking them the same question in the same way often produces misleading comparisons. Desk-based roles tend to report presenteeism through concentration and task-completion problems, which is exactly what the SPS-6’s “avoiding distractions” subscale is built to catch. Physical roles more often show up through pace, error rates, or safety near-misses, dimensions a purely cognitive scale barely touches.
Organizational culture layers on top of that. In workplaces where taking sick leave carries stigma or where managers implicitly reward attendance over recovery, employees are more likely to underreport how much a health issue affected their output, since admitting impairment can feel like admitting weakness. A high-pressure sales culture and a flexible, output-focused tech team will generate systematically different presenteeism scores even at identical true impairment levels, simply because norms around disclosure differ.
This matters practically: never benchmark presenteeism scores across departments or job functions without accounting for role type and local management norms. A “high” score in one team and a “moderate” score in another might reflect nothing more than how safe employees feel admitting they are struggling. Segmenting results by role and, where possible, surveying anonymously rather than through direct manager channels tends to produce more honest, comparable data across a diverse workforce.
Self-Reported vs. Objective Presenteeism Measures: Which Is More Accurate?
Neither category wins outright, and treating one as automatically superior is the most common mistake in this field. Self-report instruments like the SPS-6 and WPAI capture the subjective experience of impairment, which matters because two employees with the same objective output drop might feel very differently affected. But self-report is vulnerable to recall bias, social desirability, and the scaling inconsistencies already noted between 0 to 10 ratings and hours-based estimates.
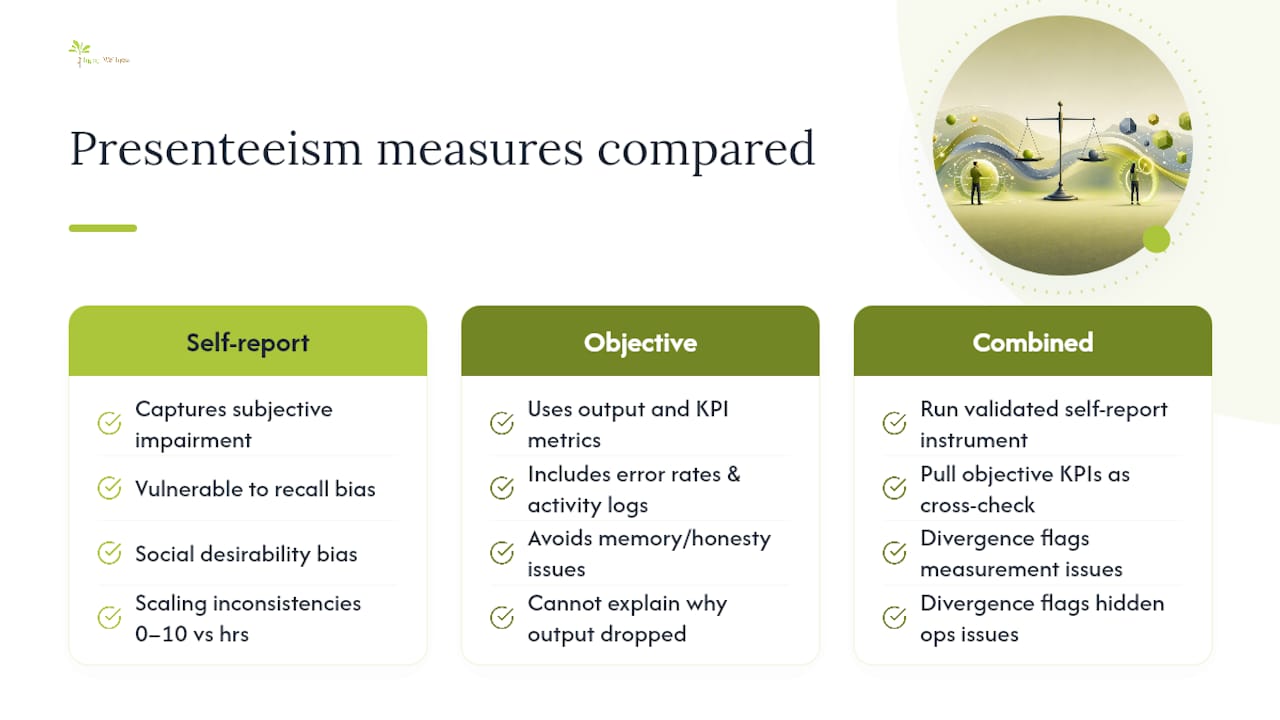
Objective proxies, absence records, output metrics, error rates, digital activity logs, sidestep memory and honesty issues but introduce a different problem: they cannot tell you why output dropped. A slow week could reflect illness, a broken process, low demand, or a distracted employee dealing with a personal crisis that has nothing to do with health.
The most defensible approach uses both. Run a validated self-report instrument for the subjective impairment signal, and pull objective KPIs, output volume, error rates, or system activity, where available, as a cross-check. When the two diverge sharply for a specific team, that gap itself becomes useful information, often pointing to either a measurement problem or a hidden operational issue worth investigating directly rather than through survey data alone.
What New Technologies Are Emerging in Presenteeism Measurement?
Digital pulse surveys have largely replaced the annual paper questionnaire, letting HR teams field a short SPS-6 or SPQ style question weekly or biweekly through mobile apps rather than waiting for an annual engagement cycle. That shift alone improves recall accuracy, since a 7-day window administered weekly beats a 3-month recall administered once a year.
Passive data sources are entering the picture too. Some organizations now supplement self-report with anonymized, aggregated digital activity patterns, work hours, system logins, task completion timestamps, as a proxy signal, though this raises real privacy considerations and works best as a directional check rather than a standalone measure. Wearable health data is being explored in some research contexts to correlate physiological markers like sleep and stress indicators with self-reported productivity impairment, though this remains more common in academic studies than routine corporate practice.
Natural language processing tools are also starting to appear in open-text survey responses, helping HR teams spot recurring themes, workload complaints versus concentration issues versus physical strain, without manually coding thousands of free-text answers. None of these technologies replace a validated instrument. They extend it, giving practitioners more frequent, more granular signals to layer alongside a core tool like the SPS-6 or WPAI rather than a reason to abandon validated scales altogether.
How Do Industry-Specific Factors Change Presenteeism Measurement?
A hospital, a bank, and a construction firm cannot use the identical measurement approach and expect equally useful results. Healthcare workers face unique reporting pressure: admitting reduced performance can feel like admitting a patient safety risk, which tends to suppress honest self-report unless anonymity is airtight. Financial services roles, often desk-based and high-stakes, tend to show presenteeism through the SPS-6’s concentration and task-completion dimensions, making that subscale especially relevant for compliance-heavy, detail-sensitive work.
Manual labor and construction sectors need measurement tools sensitive to physical strain and injury risk, where a cognitive-only scale misses the point entirely, and where musculoskeletal conditions already carry a documented, sizable share of presenteeism-related economic cost. Retail and hospitality, with high shift variability and lower survey participation historically, often need shorter instruments and mobile-first administration just to get usable response rates at all.
Client-facing and team-dependent roles, sales, consulting, customer support, also demand more attention to the multiplier effects discussed earlier, since one person’s impairment visibly cascades to teammates and clients in a way a solo analyst’s does not. Adapting recall period, question wording, and delivery channel to the specific operational rhythm of each industry, rather than deploying one generic company-wide survey, is what separates a measurement program leadership actually trusts from one that gets treated as a compliance exercise.
Why the Real Value of Presenteeism Measurement Is Rarely Where People Look
Most organizations chase a single dollar figure, one clean number to put in a board deck, and that instinct undersells what good measurement actually offers. The real value sits in the subscale detail: knowing whether a team’s SPS-6 score is being dragged down by concentration problems or task-completion problems changes the intervention entirely, and that distinction gets lost the moment you collapse everything into one aggregate score for a slide.
Conventional advice treats presenteeism measurement as a costing exercise first and a diagnostic tool second. Flip that priority. The costing number matters for the business case, but it should come after you understand the pattern, not before. Compensation and multiplier effects mean your dollar estimate is always a range, never a fact, so leadership conversations built entirely around a single number are standing on shakier ground than they realize.
What should HR teams prioritize first? Get the instrument and recall period right before you touch monetization. A well-chosen SPS-6 or WPAI run consistently over time will tell you more than a hurried cost estimate built on mismatched methods ever will.
— Neelam
Ready to Measure and Reduce Presenteeism in Your Organization?
Inspire-wellness gives you a faster path to a defensible presenteeism number than building a measurement program from scratch in-house. We customize the right instrument to your objective, run the baseline and follow-up survey, calculate lost hours and estimated cost with a proper sensitivity range, and report the results in language your leadership team can act on.
Our engagements combine measurement with actual program design, so the data leads directly to interventions such as workload redesign, mental health support, or musculoskeletal programs rather than sitting in a report nobody revisits. We map findings to the Wellness Pyramid framework and track change against your original baseline, so you can show a genuine before-and-after picture at renewal time.
If your organization needs a clear read on where presenteeism is costing you the most, and a practical plan to address it, start with our workplace wellbeing improvement guide and request an assessment of your organization’s needs.
Sources
- PubMed: Reilly et al. — (presenteeism measurement reference)
- PMC article on compensation mechanisms and measurement caveats
- Frontiers: Re‑visiting the six‑item Stanford presenteeism scale (SPS‑6) and its psychometric properties (2023)